Use Timeline to plan projects right the first time. See how the pieces you can spot
gapsand overlaps before you start.
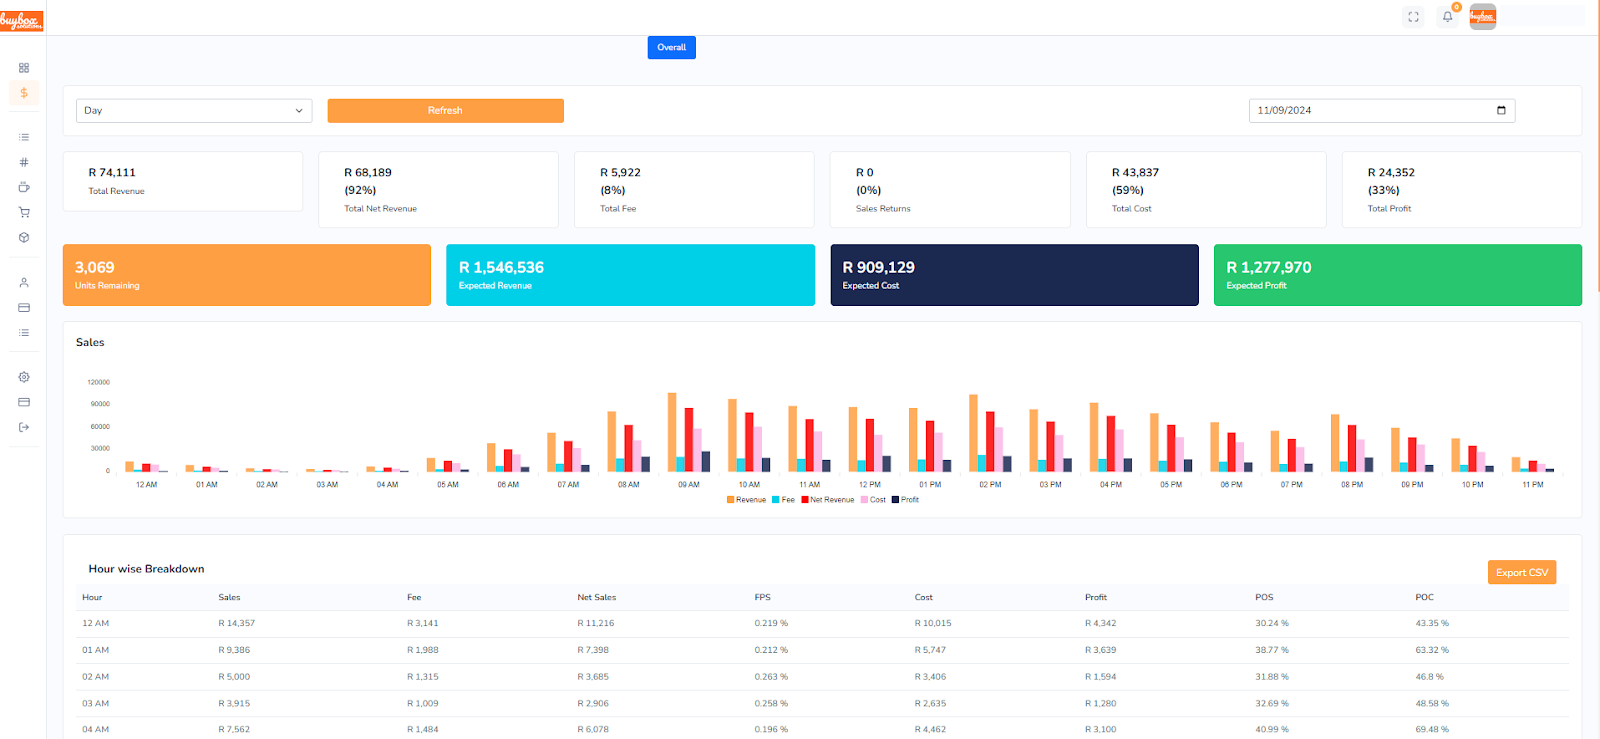
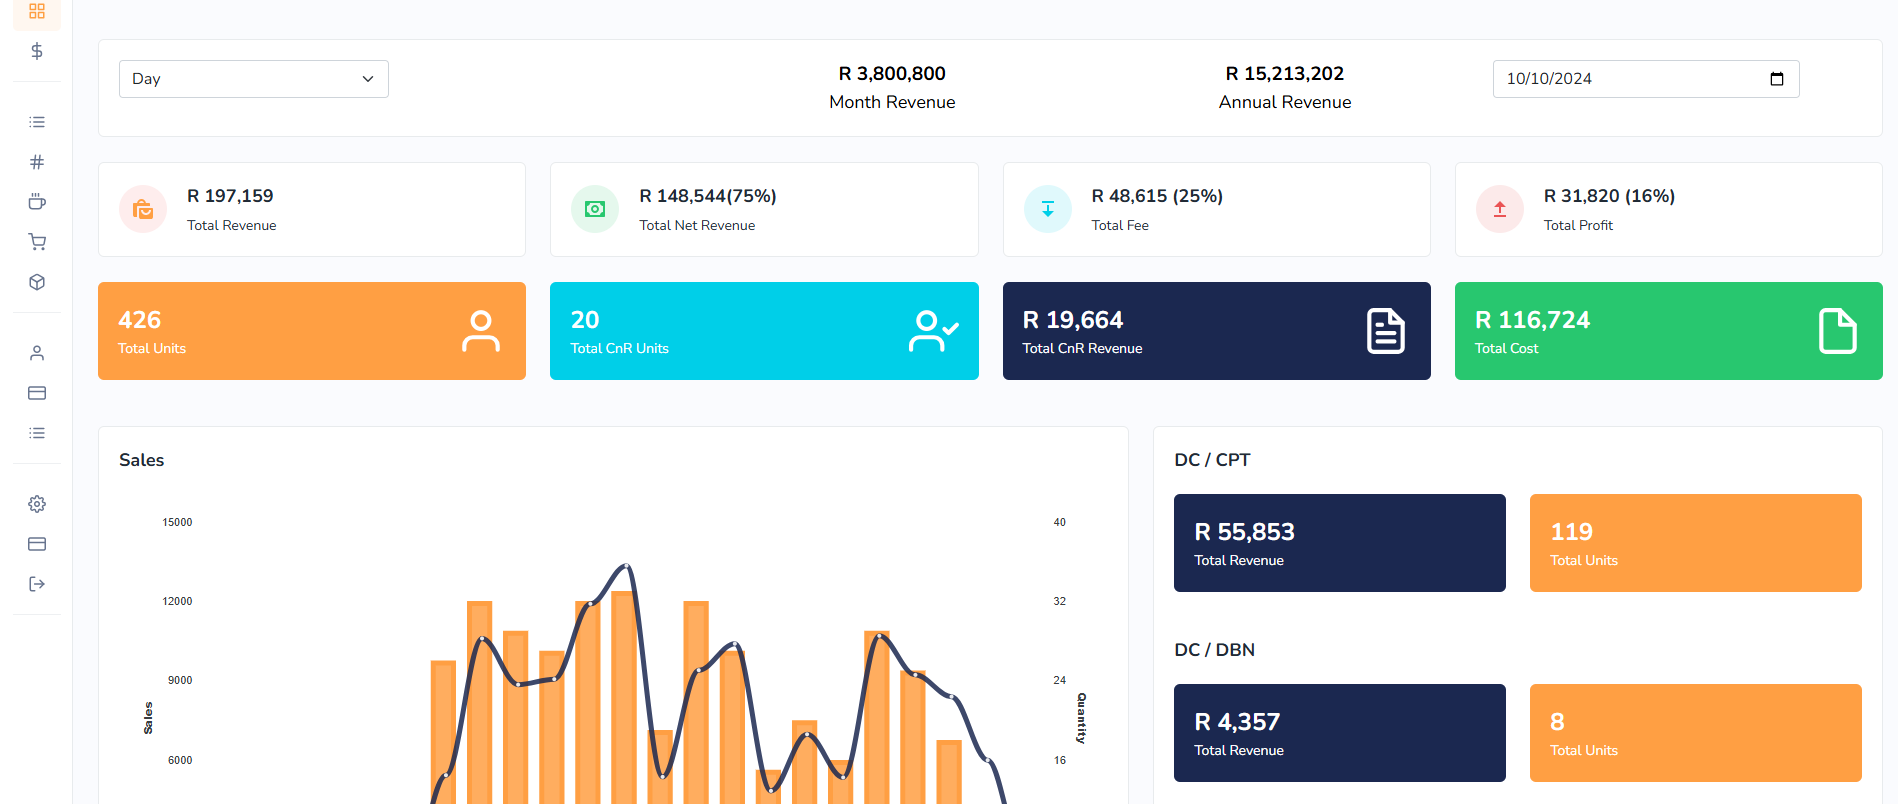
Time Period Selector
A dropdown menu allows users to select the desired time frame (e.g., Day, Week, Month) for viewing financial data. This feature lets users analyze sales and revenue trends over different periods.
Refresh Button
The “Refresh” button enables users to update the data displayed on the dashboard, ensuring the most recent information is visible.
Key Financial and Performance Metrics
Total Revenue: Shows the total revenue generated for the selected period.
Total Net Revenue: Displays the net revenue, which is revenue after deducting fees, represented alongside a percentage of the total revenue.
Total Fee: Indicates the total fees deducted, with a percentage of total revenue.
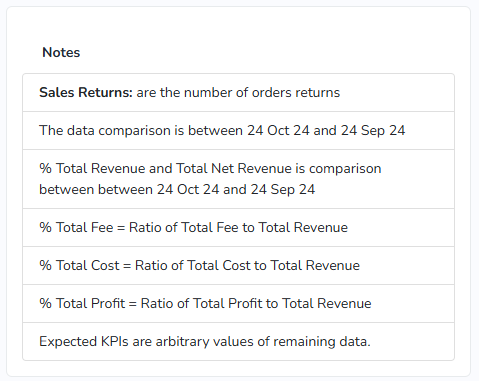
Sales Returns:Represents any sales that were returned, displayed as an absolute value and percentage of total revenue.
Total Cost: Shows the total cost of goods sold, with a percentage relative to total revenue.
Total Profit: Indicates the profit generated, along with the percentage it represents in relation to total revenue.
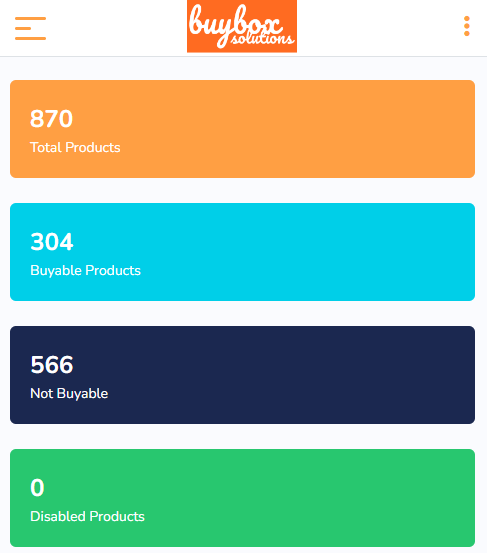
Units Remaining: Shows the quantity of unsold units still in inventory.
Expected Revenue: The forecasted revenue based on current trends.
Expected Cost: The anticipated cost if sales continue in line with current data.
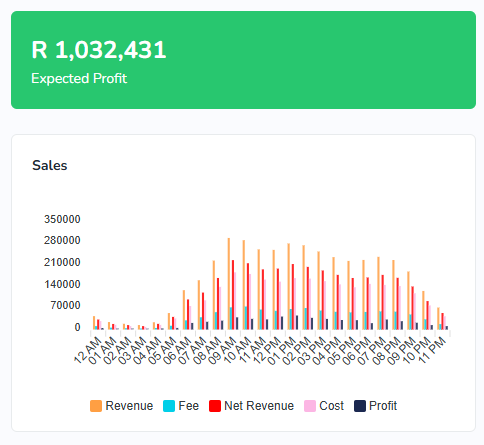
Expected Profit: The forecasted profit based on the expected revenue and cost figures.
Key Features
Sales Graph
This bar graph provides a visual hourly breakdown of various financial metrics:
Revenue (Orange): Displays the total revenue for each hour.
Fee (Red): Shows the fees incurred at each hour.
Net Revenue (Pink): Indicates the net revenue after fees.
Cost (Purple): Represents the cost of goods sold hourly.
Profit (Blue): Displays the profit for each hour.
By examining these bars, users can identify peak hours for revenue, high-cost intervals, and profit trends throughout the day.
Hour-Wise Breakdown Table
This table provides a detailed hourly breakdown of financial metrics, allowing users to monitor performance in real time. The columns include:
Hour: Indicates the time of day for each data row.
Sales: Shows total sales for that hour.
Fee: Displays fees deducted in each hour.
Net Sales: Represents sales after deducting fees.
FPS (Fee Percentage of Sales): Shows the percentage of fees relative to sales.
Cost: Indicates the cost of goods sold per hour.
Profit: Displays profit generated for each hour.
POS (Percentage of Sales): Likely represents the percentage share of sales relative to other time intervals.
POC (Percentage of Cost): Likely represents the percentage share of costs relative to other time intervals.
Export CSV Button: Allows users to download the hour-wise breakdown data in CSV format for further analysis or record-keeping.
Summary
This dashboard is a powerful tool for monitoring real-time and forecasted financial performance. It includes total and expected metrics for revenue, cost, and profit, as well as a detailed hourly breakdown. The sales graph and breakdown table allow for quick insights into peak performance times, cost management, and profit maximization strategies. The ability to refresh data and export reports enhances its utility for continuous tracking and analysis.
Automated Marketing Solutions
Enhance your marketing efforts with automation. Our platform allows you to run targeted campaigns, manage promotions, and analyze performance to drive traffic and conversions.