BuyBox Solution
The dashboard in this interface provides a comprehensive overview of sales, revenue, and key performance indicators. Here is an explanation of each section and the options available to the user:
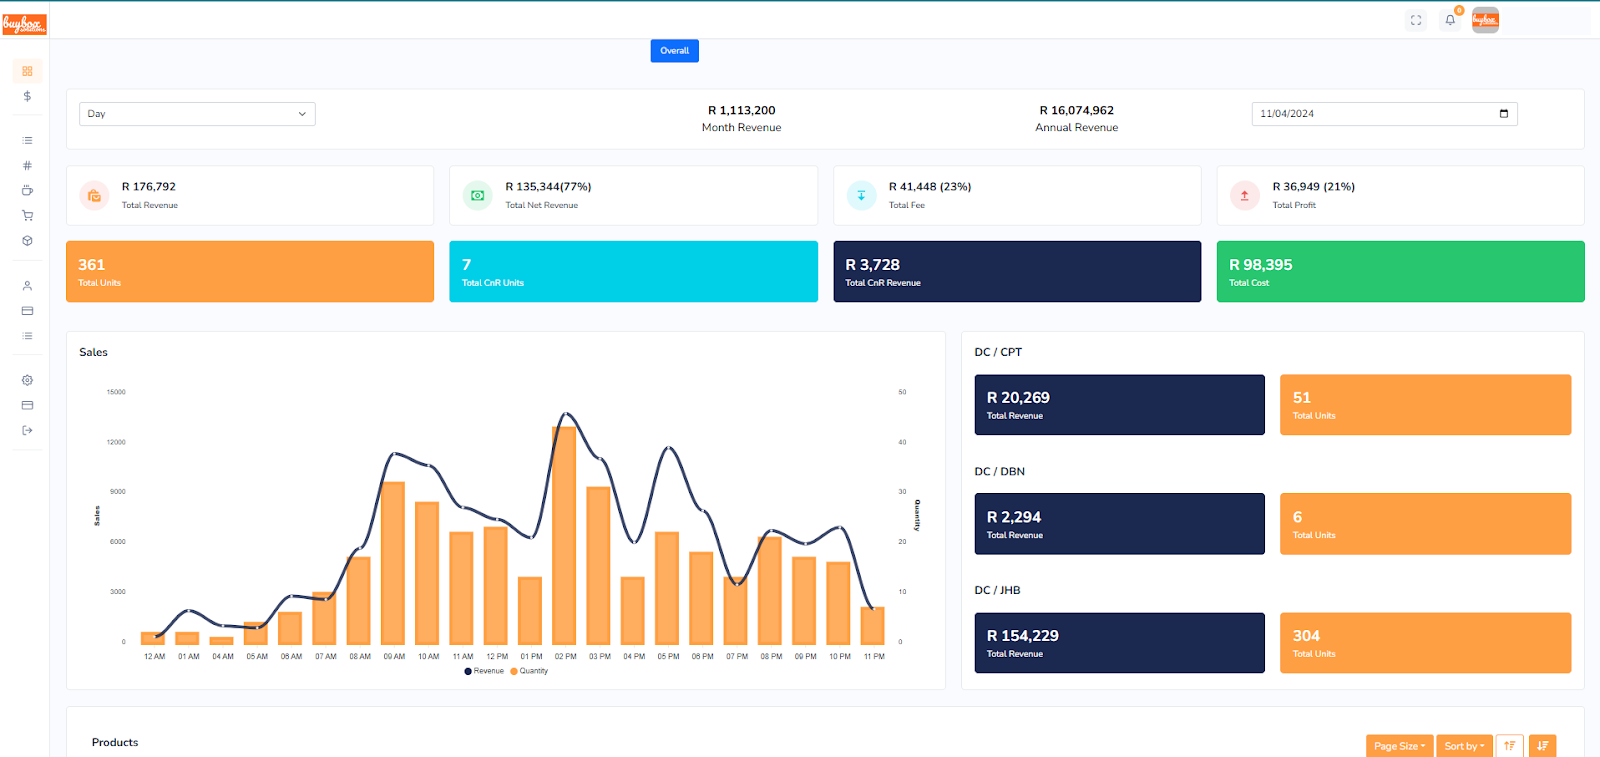
Time Period Selector
- Users can select different time frames (e.g., Day, Week, Month) from the dropdown menu to filter the displayed data. This allows for analysis of revenue, costs, and units sold over various time periods.
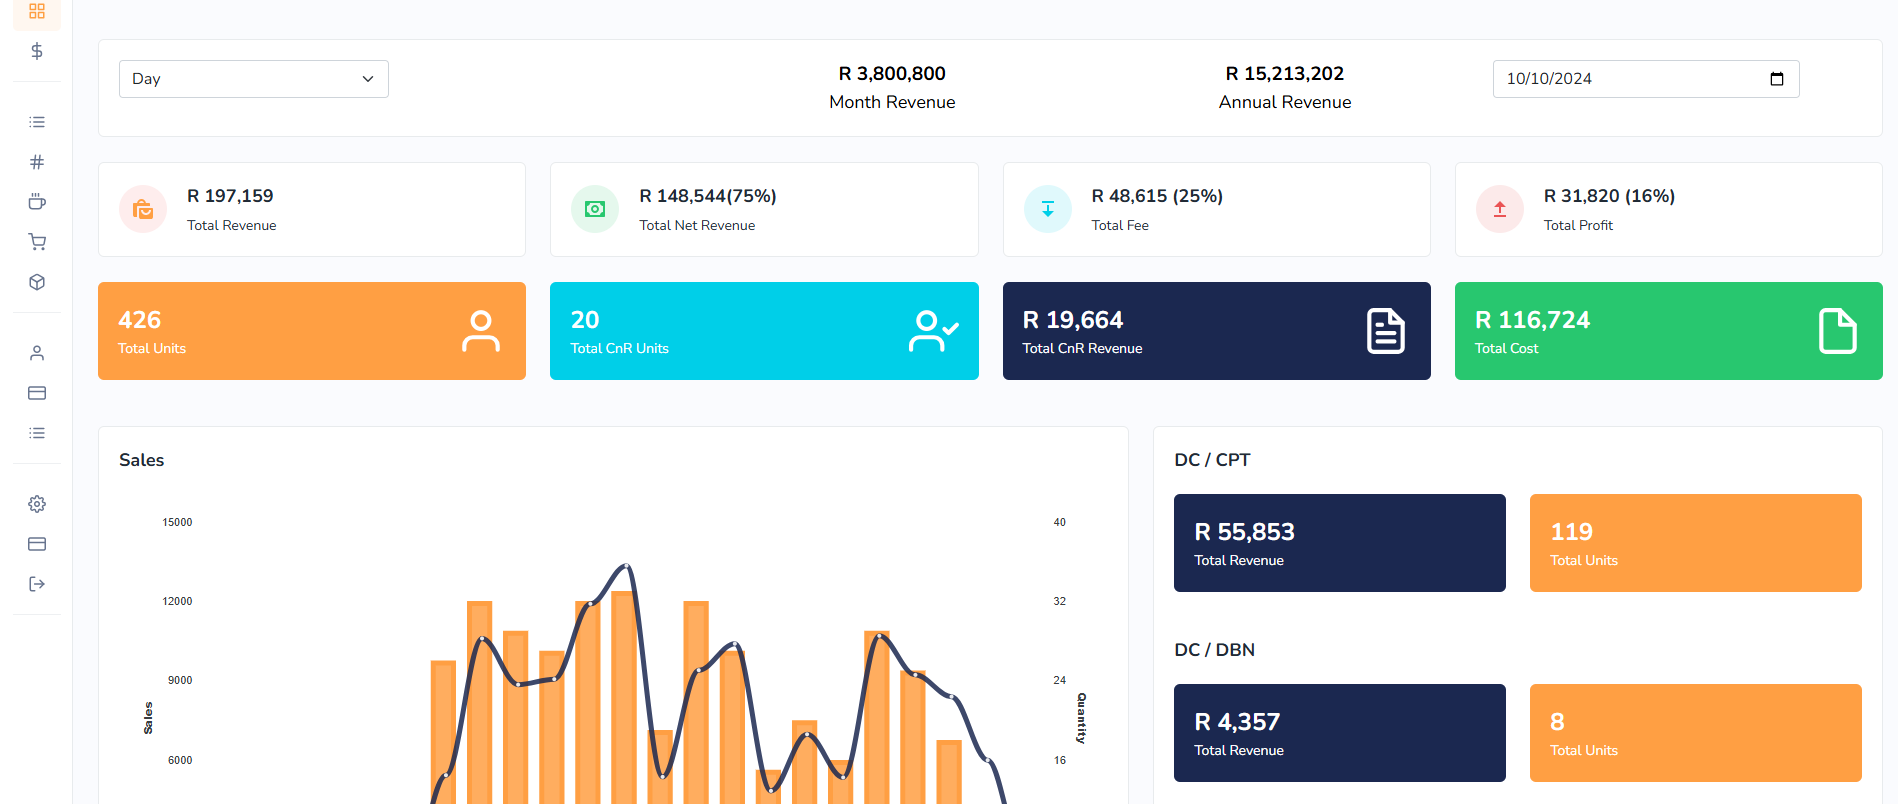
Key Revenue Metrics
- Total Revenue: Displays the total revenue generated within the selected period.
- Month Revenue: Shows the revenue accumulated throughout the current month.
- Annual Revenue: Displays the revenue for the entire year to date.
- Date Picker: Allows users to select a specific date to view data from that particular day.
Detailed Financial and Sales Metrics
- Total Revenue: Reiterates the total revenue in a prominent display.
- Total Net Revenue: Shows the net revenue, which is the revenue after deducting applicable costs or fees. A percentage is displayed alongside, indicating the share of net revenue in relation to total revenue.
- Total Fee: Displays the total fees incurred, with the percentage indicating its share of total revenue.
- Total Units: Shows the total number of units sold in the selected time frame.
- Total CnR Units: Indicates the count of CnR (possibly ‘Canceled and Returned’ or ‘Correction and Replacement’) units, reflecting products that did not contribute to sales.
- Total CnR Revenue:Displays the revenue generated specifically from CnR units.
- Total Profit:Shows the profit amount and the profit percentage relative to total revenue.
- Total Cost: Reflects the total cost incurred for the products sold.
Sales Graph
- The "Sales" graph provides a visual representation of sales activity throughout the day (or selected period), showing both revenue and quantity sold. Key features include:
- Revenue Line (Blue): Shows the trend of revenue across different time intervals.
- Quantity Bars (Orange): Displays the number of units sold at each time interval, allowing for easy analysis of sales volume trends.
- This graph helps users track peak sales times and evaluate daily sales performance.
Location-Based Revenue and Units
- This section provides a breakdown of revenue and units sold across different distribution centers (DCs):
- DC / CPT: Represents total revenue and units sold from Cape Town (CPT).
- DC / DBN: Displays revenue and units from Durban (DBN).
- DC / JHB: Shows revenue and units from Johannesburg (JHB).
- Each location has separate metrics for "Total Revenue" and "Total Units," which helps users understand geographic performance.
Pagination and Sorting Options
- Page Size: Allows users to adjust the number of entries displayed per page.
- Sort By: Enables sorting of the data based on various parameters, like total units, revenue, or location-specific performance.
Additional Functionalities (Potentially Available)
- Filter Options: Users may have access to advanced filters (not visible in this image) to further refine data by product category, location, or other attributes.
- Export/Download Data: This type of dashboard often includes options to export or download data for further analysis, although this specific feature is not shown in the image.
Pricing Plans & Packages
Basic
- Total Subscribers 0
- Total Active Subscribers 0
- Trail: 15 days.
- Upto 60 SKUs can be added
- 1 store included
- Unlimited Invoice Downloading
- Unlimited BuyBox Monitoring
- Unlimited Email Reports
- Help center access
Standard
- Total Subscribers 0
- Total Active Subscribers 0
- Trail: 15 days.
- Upto 110 SKUs can be added
- 2 store included
- Unlimited Invoice Downloading
- Unlimited BuyBox Monitoring
- Unlimited Email Reports
- Help center access
Advanced
- Total Subscribers 0
- Total Active Subscribers 0
- Trail: 15 days.
- Upto 300 SKUs can be added
- 3 store included
- Unlimited Invoice Downloading
- Unlimited BuyBox Monitoring
- Unlimited Email Reports
- Help center access
Premium
- Total Subscribers 0
- Total Active Subscribers 0
- Trail: 15 days.
- Upto 700 SKUs can be added
- 3 store included
- Unlimited Invoice Downloading
- Unlimited BuyBox Monitoring
- Unlimited Email Reports
- Help center access
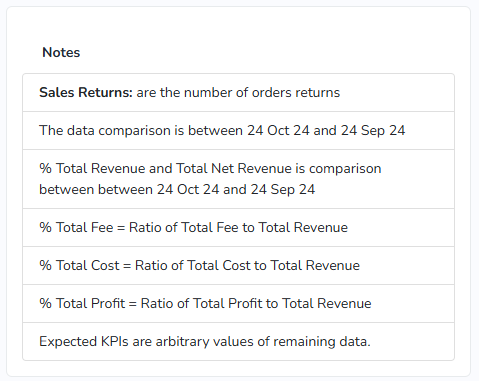
Summary
This interface provides a powerful set of tools for monitoring sales, revenue, profit, and cost metrics across different locations and time periods. The graph and summary boxes make it easy to track performance trends, understand cost implications, and identify high-performing locations or time intervals for sales. The interface is designed for quick insights into business performance and supports effective decision-making based on the data presented.
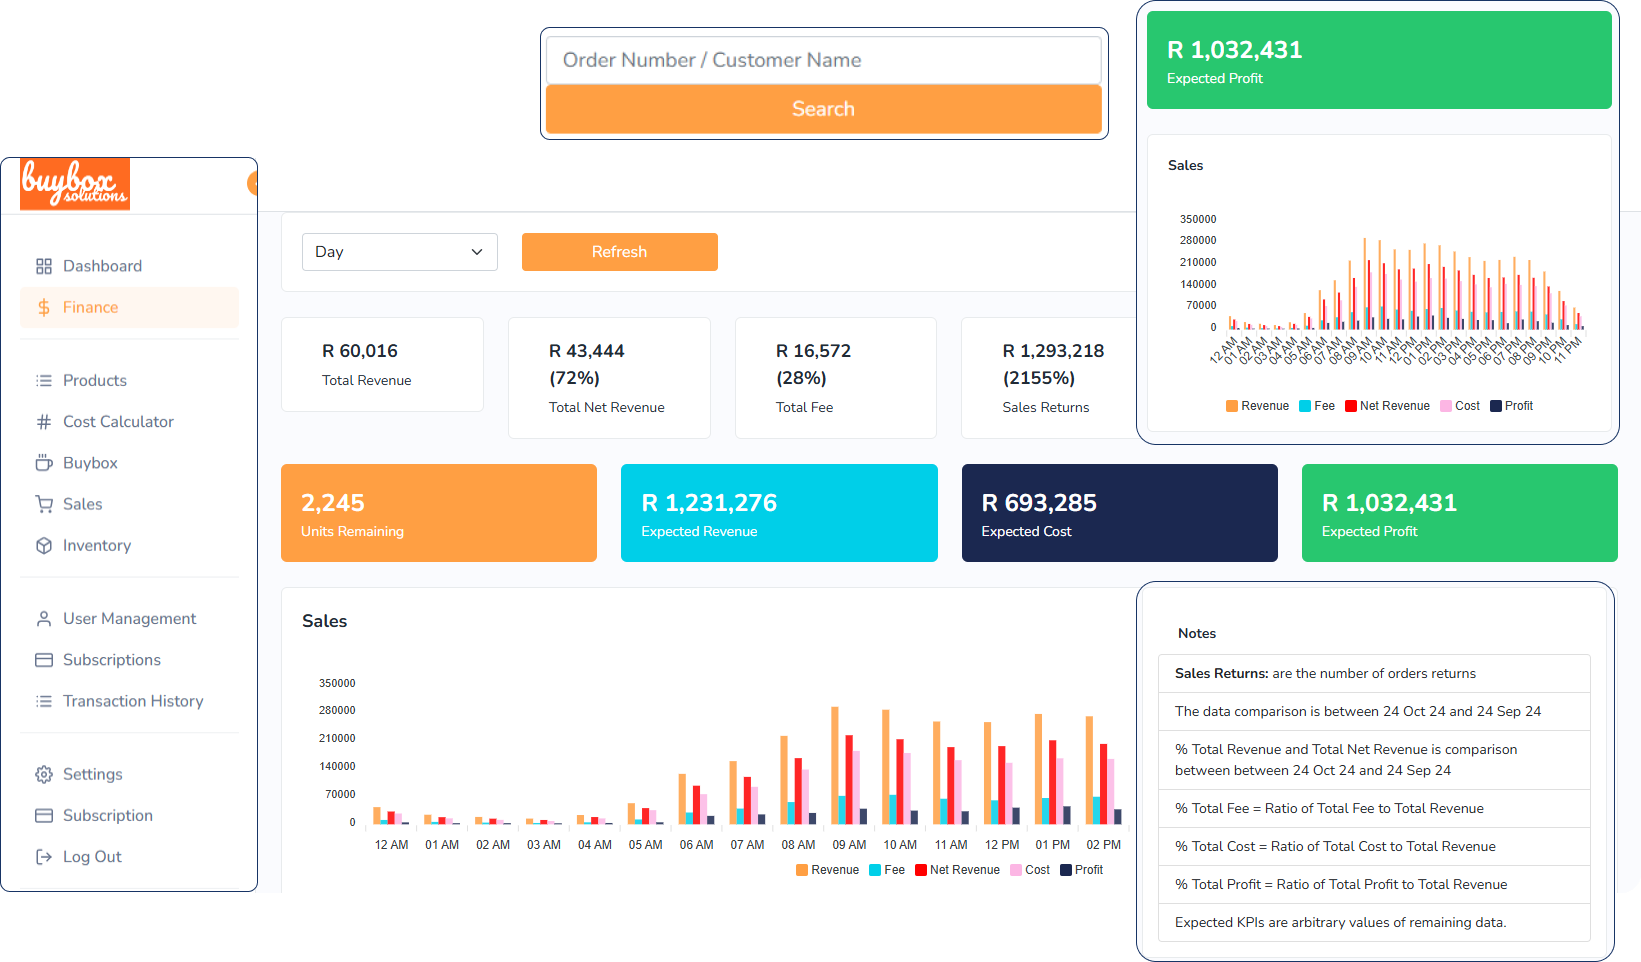
Finance Solutions
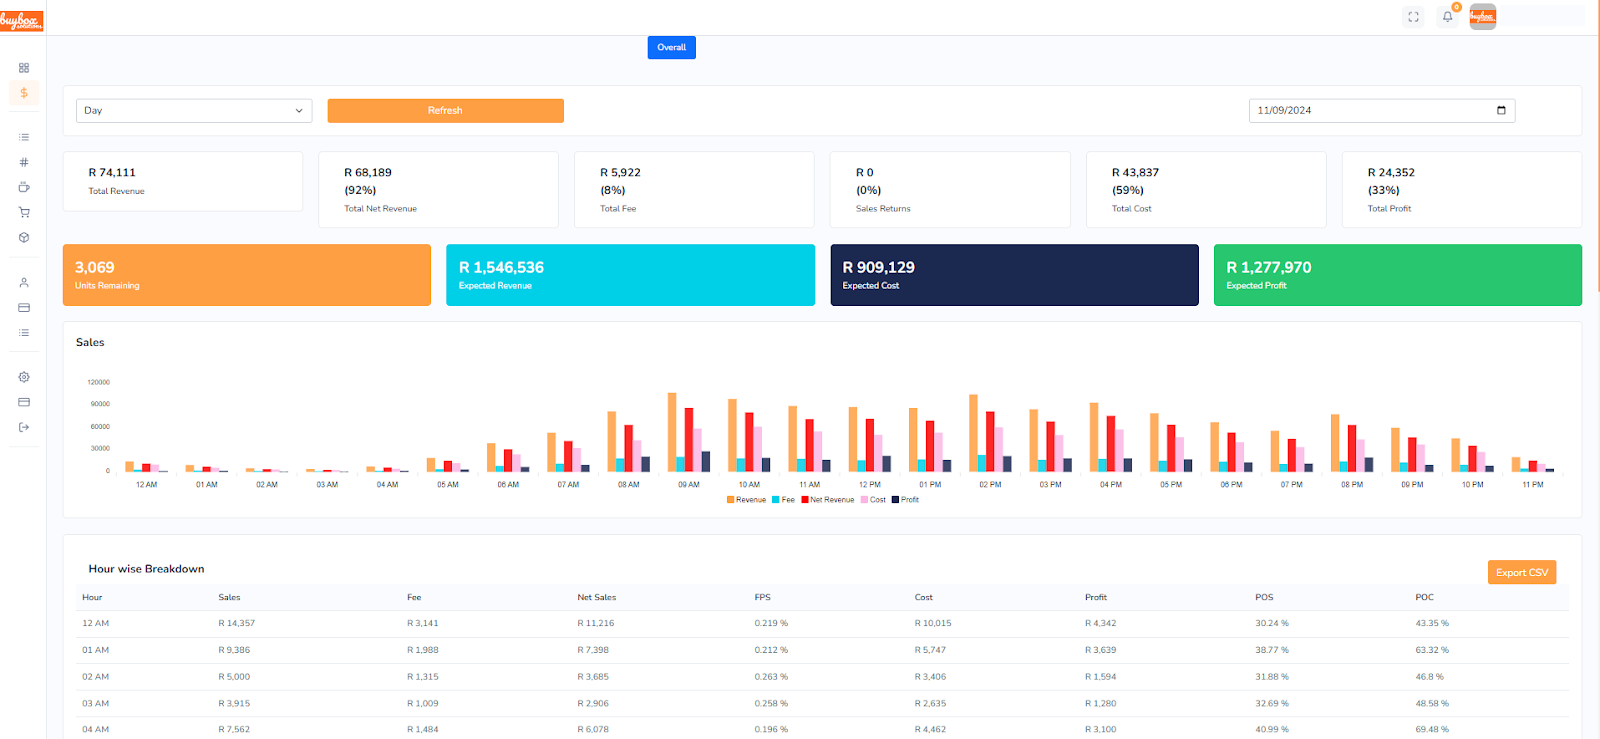
Time Period Selector
Refresh Button
Key Financial and Performance Metrics
- Total Revenue: Shows the total revenue generated for the selected period.
- Total Net Revenue: Displays the net revenue, which is revenue after deducting fees, represented alongside a percentage of the total revenue.
- Total Fee: Indicates the total fees deducted, with a percentage of total revenue.
- Sales Returns:Represents any sales that were returned, displayed as an absolute value and percentage of total revenue.
- Total Cost: Shows the total cost of goods sold, with a percentage relative to total revenue.
- Total Profit: Indicates the profit generated, along with the percentage it represents in relation to total revenue.
- Units Remaining: Shows the quantity of unsold units still in inventory.
- Expected Revenue: The forecasted revenue based on current trends.
- Expected Cost: The anticipated cost if sales continue in line with current data.
- Expected Profit: The forecasted profit based on the expected revenue and cost figures.
Key Features
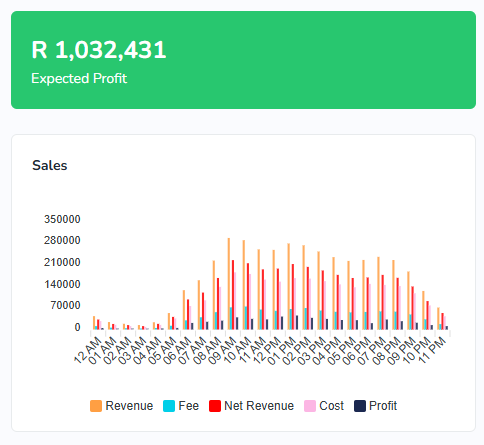
Sales Graph
- This bar graph provides a visual hourly breakdown of various financial metrics:
- Revenue (Orange): Displays the total revenue for each hour.
- Fee (Red): Shows the fees incurred at each hour.
- Net Revenue (Pink): Indicates the net revenue after fees.
- Cost (Purple): Represents the cost of goods sold hourly.
- Profit (Blue): Displays the profit for each hour.
- By examining these bars, users can identify peak hours for revenue, high-cost intervals, and profit trends throughout the day.
Hour-Wise Breakdown Table
- This table provides a detailed hourly breakdown of financial metrics, allowing users to monitor performance in real time. The columns include:
- Hour: Indicates the time of day for each data row.
- Sales: Shows total sales for that hour.
- Fee: Displays fees deducted in each hour.
- Net Sales: Represents sales after deducting fees.
- FPS (Fee Percentage of Sales): Shows the percentage of fees relative to sales.
- Cost: Indicates the cost of goods sold per hour.
- Profit: Displays profit generated for each hour.
- POS (Percentage of Sales): Likely represents the percentage share of sales relative to other time intervals.
- POC (Percentage of Cost): Likely represents the percentage share of costs relative to other time intervals.
Export CSV Button: Allows users to download the hour-wise breakdown data in CSV format for further analysis or record-keeping.


Summary
This dashboard is a powerful tool for monitoring real-time and forecasted financial performance. It includes total and expected metrics for revenue, cost, and profit, as well as a detailed hourly breakdown. The sales graph and breakdown table allow for quick insights into peak performance times, cost management, and profit maximization strategies. The ability to refresh data and export reports enhances its utility for continuous tracking and analysis.
Automated Marketing Solutions
Products BuyBox Overview
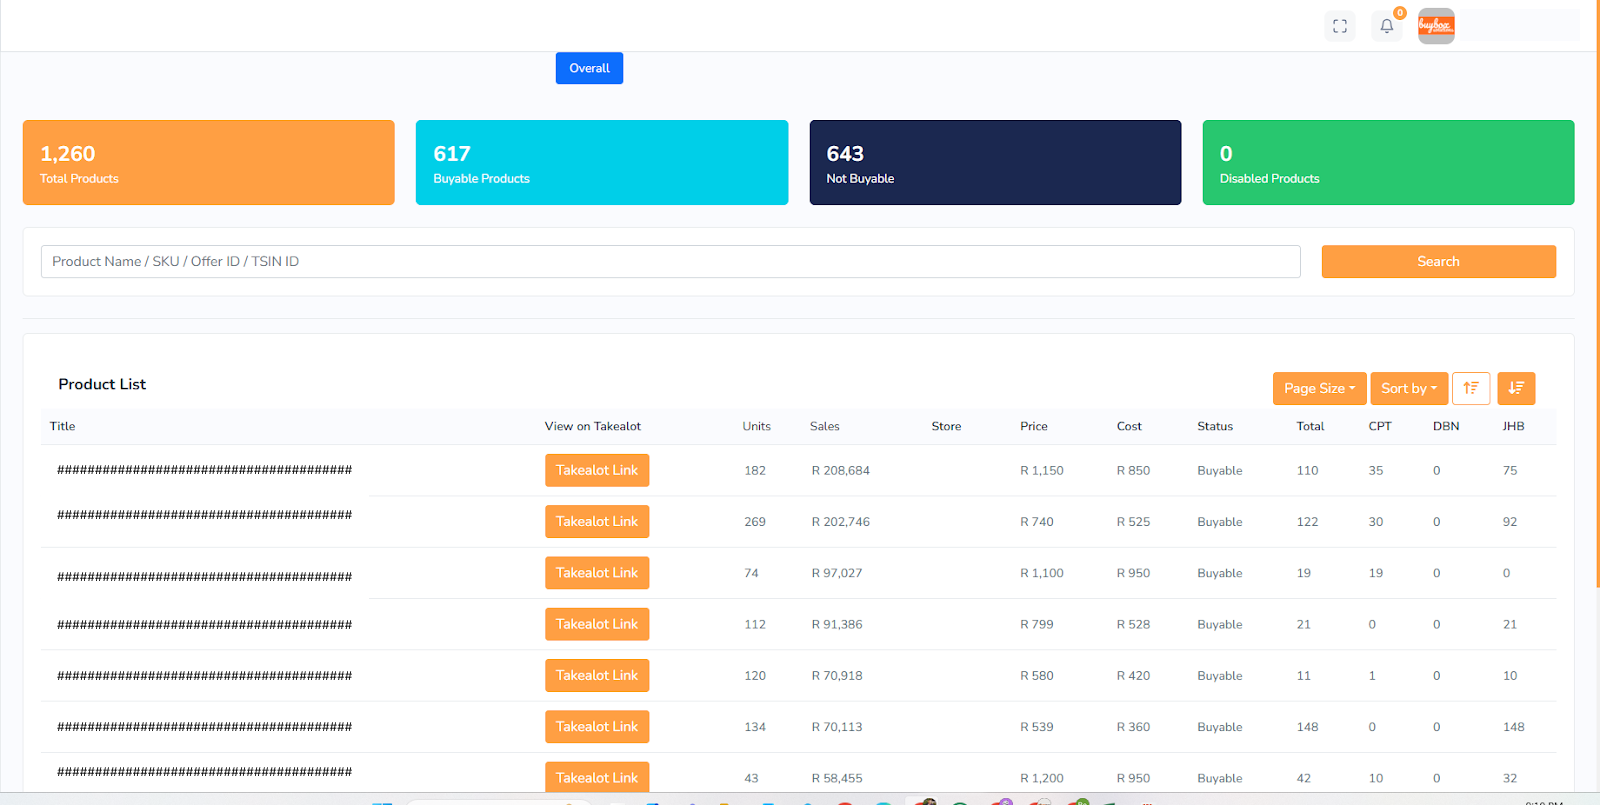
The “Products” section in this interface provides a range of options for viewing and managing the products. Here’s an outline of each feature and option available in this section based on the interface:
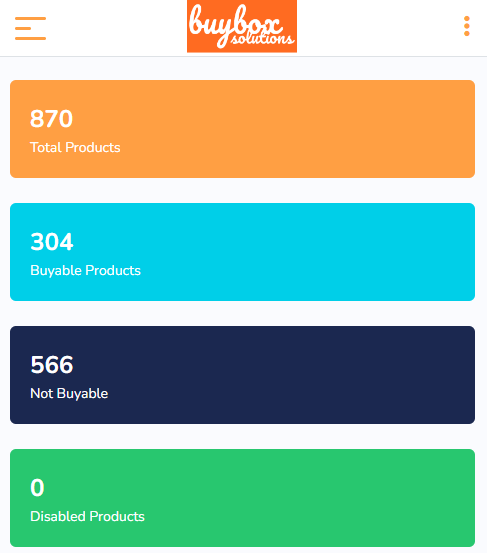
Overview Counters
Total Products: Displays the total number of products listed in the system.
Buyable Products: Shows the count of products that are currently available for customers to purchase.
Not Buyable Products: Indicates the number of products that are listed but not available for purchase.
Disabled Products: Represents products that have been disabled, making them inactive or hidden.
Search Functionality
A search bar allows users to locate specific products by entering identifiers like:
Product Name
SKU (Stock Keeping Unit)
Offer ID
TSIN ID (likely a unique identifier for each product)
Product List Table
Title: Displays the name of each product with a preview of the title.
View on Takealot: Each product has a “Takealot Link” button that allows users to view the product on the Takealot platform.
Units: Shows the quantity of each product available or in stock.
Sales: Displays the sales revenue or amount generated for each product.
Store: Identifies the specific store where each product is listed.
Price: Shows the selling price for each product.
Cost: Indicates the base or purchase cost of the product.
Status: Displays the availability status of each product (e.g., “Buyable” if available for purchase).
Location Distribution: Represents stock distribution or availability across different locations:
CPT: Cape Town
DBN: Durban
JHB: Johannesburg
Happy Customers
Happy Customers
Trusted By 12,000 Customers Using Our Software!

James R.
Business Owner


Benefits of BuyBox Solution
Pagination and Sorting Options
Page Size: Allows users to select the number of products displayed per page.
Sort By: Provides sorting options to organize products based on specific criteria, such as price or sales.
Filter Options
There is a filter icon that allows users to further refine the product list based on various parameters, such as:
Status (e.g., Buyable or Not Buyable)
Price Range
Location
These filters help users narrow down the product list for more efficient management.
Additional Features and Potential Options:
While the image does not show specific buttons for adding or deleting products, this type of interface generally includes options for:
Editing Product Details: Users might be able to click on a product to edit details like title, price, stock, and status.
Bulk Actions: The system may support bulk actions to manage multiple products at once, such as updating stock or changing the status of selected items.
In essence, this interface provides a comprehensive view of product inventory, sales performance, and availability across locations. Users can search, filter, and sort products, view specific product details on external platforms, and likely manage stock and visibility based on location.

Cost: Shows the cost of the product, allowing users to assess profit margins.
Cost (USD): Another column for product cost, presumably in USD, though in this instance, all values are shown as $0.
Store: Identifies the store where the product is listed (e.g., “HurriaJ,” “Jmart”).
Status: Displays whether the product is “Buyable” or “Not Buyable.”

Cost Calculator
This “Cost Calculator” section provides users with an interface for managing product inventory and tracking sales metrics. Here’s a detailed explanation of each feature and option available:
Overview Counters
Total Products: Displays the total count of products available in the system.
Buyable Products: Shows the number of products currently available for purchase.
Not Buyable: Indicates the number of products that are listed but not available for purchase.
Disabled Products: Represents products that are disabled and not active in the system.
Search Bar
Users can search for specific products by entering keywords or identifiers such as:
Product Name
SKU (Stock Keeping Unit)
Offer ID
TSIN ID (likely a unique product identifier)
Product List Table
Title: Shows the product name along with additional identifying details like product codes.
Units: Indicates the quantity of each product in stock or sold.
Sales: Displays the revenue generated from each product.
Our Special Blogs

Free And Open Source Software

Free And Open Source Software
Free And Open Source Software
Allows users to navigate between pages in the product list. In this case, users can move to the next page by clicking on page numbers or the “Next” button.
Page Size: Users can adjust the number of items displayed per page.
Sort By: Allows sorting of products based on different criteria, like units, sales, or cost, to help users analyze the list effectively.
The “Update from CSV” button enables users to upload a CSV file to update product details in bulk. This feature is especially useful for making large-scale adjustments to the product list, such as updating inventory levels, prices, or statuses.
Filter Options: Although not shown explicitly in the image, users might have access to filtering options to refine the product list based on status, store, or cost ranges.
Summary
This section allows users to view and manage a product inventory, including tracking unit sales, costs, and availability. Key features include a searchable and sortable table, pagination controls for easier navigation, and the ability to bulk update product information using a CSV file. This interface is designed to facilitate quick inventory assessments, pricing adjustments, and product status management.
FAQ's
What platforms does BuyBox Solution integrate with?
BuyBox Solution integrates seamlessly with major e-commerce platforms such as Amazon, Shopify, eBay, and more, allowing you to manage all your sales channels in one place.
How does the free trial work?
Our free trial allows you to explore all features of BuyBox Solution for 14 days without any commitment. Experience the full potential of our platform before making a decision.
Is there a setup fee?
No, there are no hidden fees or setup costs. You can start using BuyBox Solution immediately after signing up for the free trial.
What kind of support do you offer?
We provide 24/7 customer support via email and chat. Our dedicated team is here to help you with any questions or issues you may encounter.